This is an old revision of the document!
Helpful Links & Downloads
AS9100 (Aerospace)
Online Aerospace Supplier Information System (OASIS)
International Aerospace Quality Group (IAQG)
IAQG OPMT ICOP Resolutions Log
IAQG Supply Chain Management Handbook (SCMH)
SAE forms for AS9100D, AS9102 (FAIRs), 9104-002, 9145 (PPAP Approval)
or
AAQG Publications (incl. Forms for AS9100D & AS9102B (FAIRs))
ISO 9001
ISO 9001 Auditing Practices Group OR ISO 9001 Auditing Practices Group
WG22 U.S. Guidance for handling requests for interpretation of the requirements of ISO 9001.docx
ISO 9001 Interpretations Request Form N691.docx
Expected Outcomes for Accredited Certification to ISO 9001 (IAF Publication)
Flowcharting Symbology / Conventions (Based upon ISO 5807:1985)
General Quality Tools & Templates
QMS / EMS Certification
LEAN Six Sigma Training & Certifications
"Go Lean Six Sigma" Training & Certifications
LSSI Lean Six Sigma Training & Certifications
SSGI Lean Six Sigma Black Belt Certification
FREE LEAN Six Sigma Training
FREE Lean 6 Sigma White Belt Training & Certification is available from:
https://www.msicertified.com/lean-six-sigma-white-belt-certification.html
FREE Lean 6 Sigma Yellow Belt Training is available from GoLeanSixSigma.com. Just set up an account at:
https://goleansixsigma.com/register-start-free-yellow-belt-training/
LEAN Six Sigma Learning Resources
Toyota Production System (TPS)
Lean Six Sigma Glossary (from iSixSigma.com)
Six Sigma Glossary (from MiC Quality)
SPC Glossary (from DataNet Quality Systems)
Policy Deployment: How to do with Hoshin Kanri and X-Matrix (Video from BMGI Problem Solved)
The Seven Steps of Hoshin Planning (Article from “Lean Methods”)
Hoshin Policy Deployment Templates: X-Matrix (Excel templates from “Lean Methods”)
Process Sigma Calculator
Process Sigma Calculator (from iSix Sigma)
Process Capability Calculator (from Statistical Solutions, LLC)
Metrology
Sources for Standards
Downloads
"SWOT & Strategic Risk Assessment Bubble Chart" template in Excel (8-12-2018)
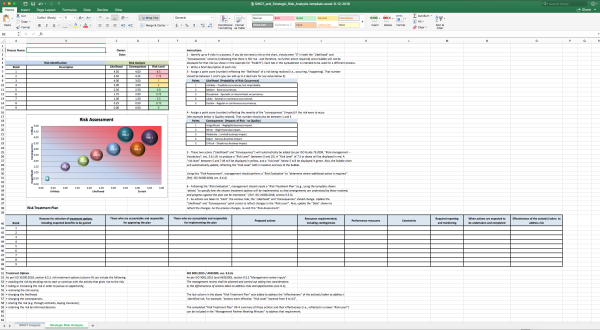
SWOT & Strategic Risk Assessment Bubble Chart (Excel)
The “SWOT & Strategic Risk Assessment Bubble Chart” template (Excel)“ is based on the guidance provided from ISO 31000:2018, “Risk management — Principles and guidelines”. Use the SWOT to help identify up to 9 strategic risks. Then assign a point score (0-10) for the likelihood (probability) and “Consequences” (Impact) of each risk. These two scores (“Likelihood” and “Consequences”) will automatically be added to produce a “Risk Level” (between 1 and 10). And the “Bubble” chart will automatically update; reflecting the “Risk Level” both in location and size of the bubbles. The template also includes a “Risk Treatment Plan” (as per ISO 31000:2009, section 6.4). This template includes instructions for its use.
"Process Risk Assessment Bubble Chart" template in Excel (8-12-2018)
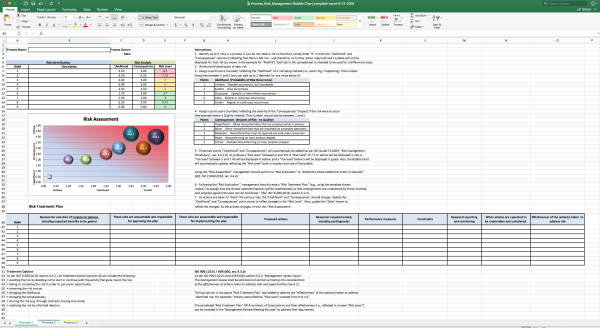
[Process Risk Assessment Bubble Chart (Excel)
The “Process Risk Assessment Bubble Chart” template (Excel)” is based on the guidance provided from ISO 31000:2018, “Risk management — Principles and guidelines”. Identify up to 9 risks in a process. Then assign a point score (0-5) for the likelihood (probability) and “Consequences” (Impact) of each risk. These two scores (“Likelihood” and “Consequences”) will automatically be added to produce a “Risk Level” (between 1 and 10). And the “Bubble” chart will automatically update; reflecting the “Risk Level” both in location and size of the bubbles. The template also includes a “Risk Treatment Plan” (as per ISO 31000:2018, section 6.4). This template includes instructions for its use.
"Calibration Recall" template Excel (5-5-2018)

"Calibration Recall" template Excel (5-5-2018)
This simple Excel-based “Calibration Recall” template is designed for small companies (with under 150 instruments under calibration control) to comply with ISO 9001:2015 & AS9100D. It uses Color-coded “Conditional Cell Formatting” for visual management.
"DPMO-Sigma-Yield-Cpk Conversion Table Wallpaper" (1920x1080)
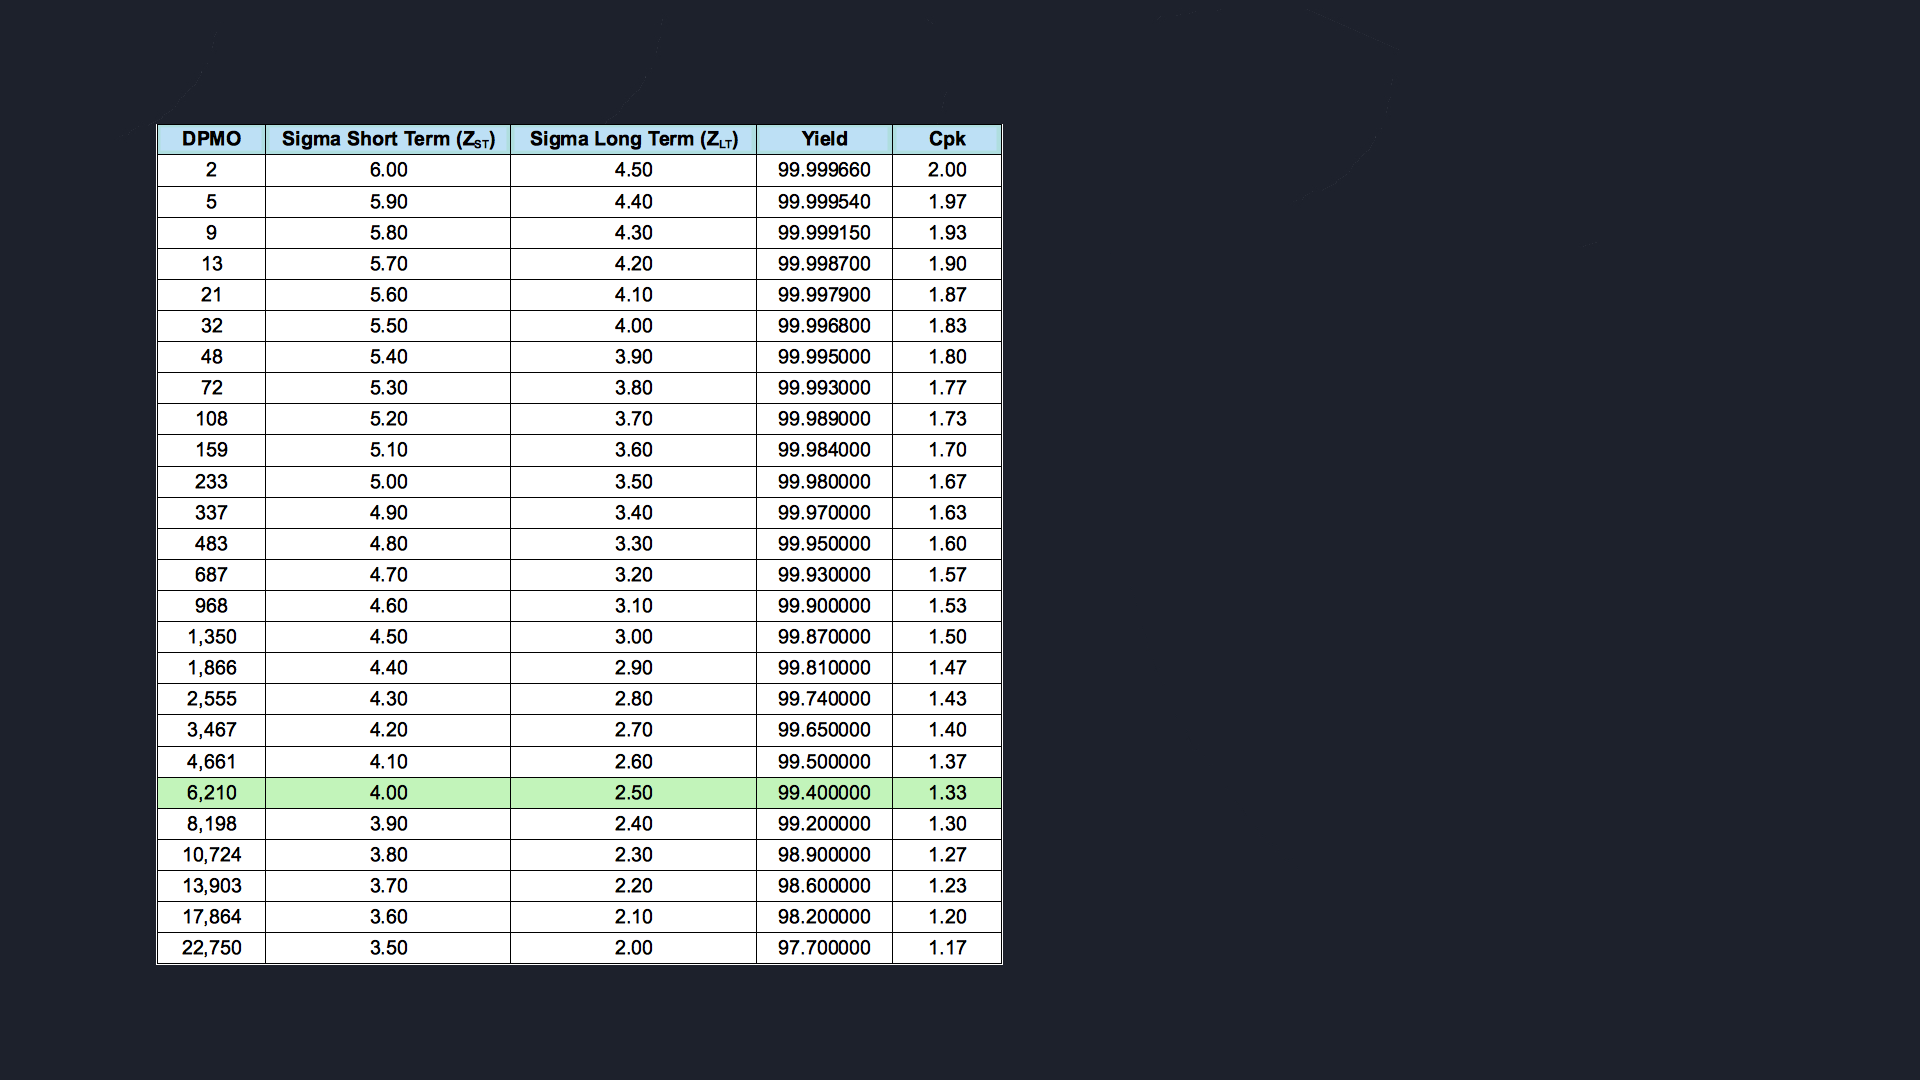
"DPMO-Sigma-Yield-Cpk Conversion Table Wallpaper" (1920x1080)
This is a “DPMO-Sigma-Yield-Cpk Conversion Table” with a black background, suitable for use as computer desktop wallpaper. The PNG image provides a quick reference to convert Yields to DPMOs to Sigma levels (Short Term & Long Term) as well as Cpk. This chart covers a range of 3.50 to 6.00 Sigma Short Term (ZST). And the row at 4.00 Sigma Short Term (ZST) is highlighted in light green to indicate a minimum acceptable process capability of 1.33 Cpk.